These pages are not displaying properly because the Compatibility View in your Internet Explorer is enabled. We suggest that you remove 'fu-berlin.de' from your list of sites that have Compatibility View enabled.
- In Internet Explorer, press the 'Alt' key to display the Menu bar, or press and hold the address bar and select 'Menu bar'.
- Click 'Tools' and select 'Compatibility View settings'.
- Select 'fu-berlin.de' under 'Websites you've added to Compatibility View'.
- Click 'Remove'.
Modelling metabolic networks (Numerics)
One characteristic for life is that every living thing has its own metabolism. Material is taken up from the surroundings, chemically changed and released in a different form to produce energy or build different biologically active compounds. Knowledge about the metabolic pathways can for example help describing diseases in humans or reveal how to get rid of unwanted bacteria.
In cells metabolism is a complex network of thousands of molecules and their reactions with each other.
Take the example from the figure where the side chains of a molecule are changed allowing for different functions in combination with other molecules. From this description we can extract how the molecule states can be produced in the first place, how much of it gets produced under certain starting conditions and manipulation of which other compound has the biggest effect on their production.
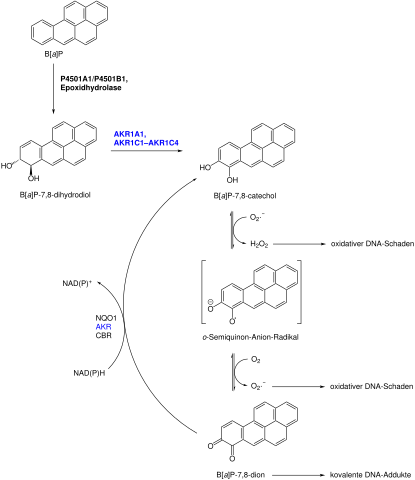
Example of a metabolic network: metabolic activation of (±)-BP-7,8-diol
Source: Wikimedia Commons — By ChemPro [Public domain]
Take the simplified system where A produces C via the intermediate B. The reactions from A to B and from B to C happen at rates k1=0.05 and k2=0.7 respectively: Both are reversable with rates k–1=0.005 and k–2=0.4. Starting concentration of all compounds is 2.
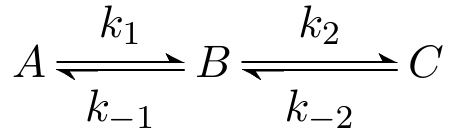
For each of the concentrations of the molecules A, B and C find the correct line in the graph. Tip: compare the forwards and backwards constants for each reaction.
red
orange
blue
You get feedback for each answer by clicking on the button.
Construction of an ordinary differential equation (ODE)
The concentration of each compound A over time can be modelled mathematically with an ordinary differential equation (ODE) which contains the concentrations of all metabolites which can react with A (also modelled with ODEs) multiplied by the rate of the reaction producing or breaking down A.
The complete system of ODEs enables us to describe the flow of material through the network and predict the state of it at any given time. Usually after an initial chaotic phase networks enter a state of balance where all compounds inside the system are produced and broken down at the same rate such their concentrations doesn't change anymore though they are still continously reacting.
Which is the correct ODE describing the concentration of molecule A? Concentrations of compounds are simply named by their compound, thus A' means differentiation of the function A (describing the concentration of compound A) with respect to time t.
The concentration of A is only dependent on itself and B. The indirect effect of C on A is sufficiently captured in the concentration of B. Over time the concentration of A diminishes with k1*A and gets replenished with k–1*B.